You're flying blind on Claude Code spending. I built a window.
Anthropic just changed how fast your 5-hour session limits burn during peak hours. No warning. No opt-in. Just a tweet from Thariq and a wave of canceled subscriptions.
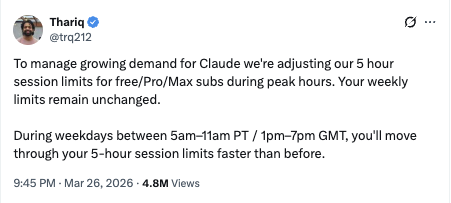 https://x.com/trq212/status/2037254607001559305
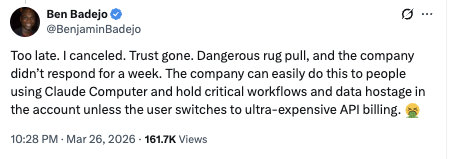
One reply from @BenjaminBadejo summed up the mood: “Too late. I canceled. Trust gone. Dangerous rug pull, and the company didn’t respond for a week. The company can easily do this to people using Claude Computer and hold critical workflows and data hostage unless the user switches to ultra-expensive API billing.”
Hard to dismiss that challenge.
The real problem isn’t the price change
Price changes happen. Every SaaS company adjusts pricing eventually. The actual problem is that most Claude Code users have zero visibility into what they’re spending. You don’t know how many tokens you burned last week. You don’t know which project is eating your session limits. You don’t know whether your $200/month Max plan is a bargain or a rip-off for your usage patterns.
You’re making financial decisions about your primary coding tool with no data.
So when Anthropic changes the terms, you can’t even evaluate what it means for you. You just feel the squeeze and react.
I got tired of guessing
Claude Code Inspector is a local analytics dashboard that reads your Claude Code session data and shows you exactly what’s going on. One command to launch:
 https://x.com/BenjaminBadejo/status/2037265411784192164
npx claude-dashboard-localThat’s it. It reads the JSONL session files already sitting in your ~/.claude directory and gives you a full breakdown: tokens per project, cost analysis, session timelines, cache efficiency, model usage splits.
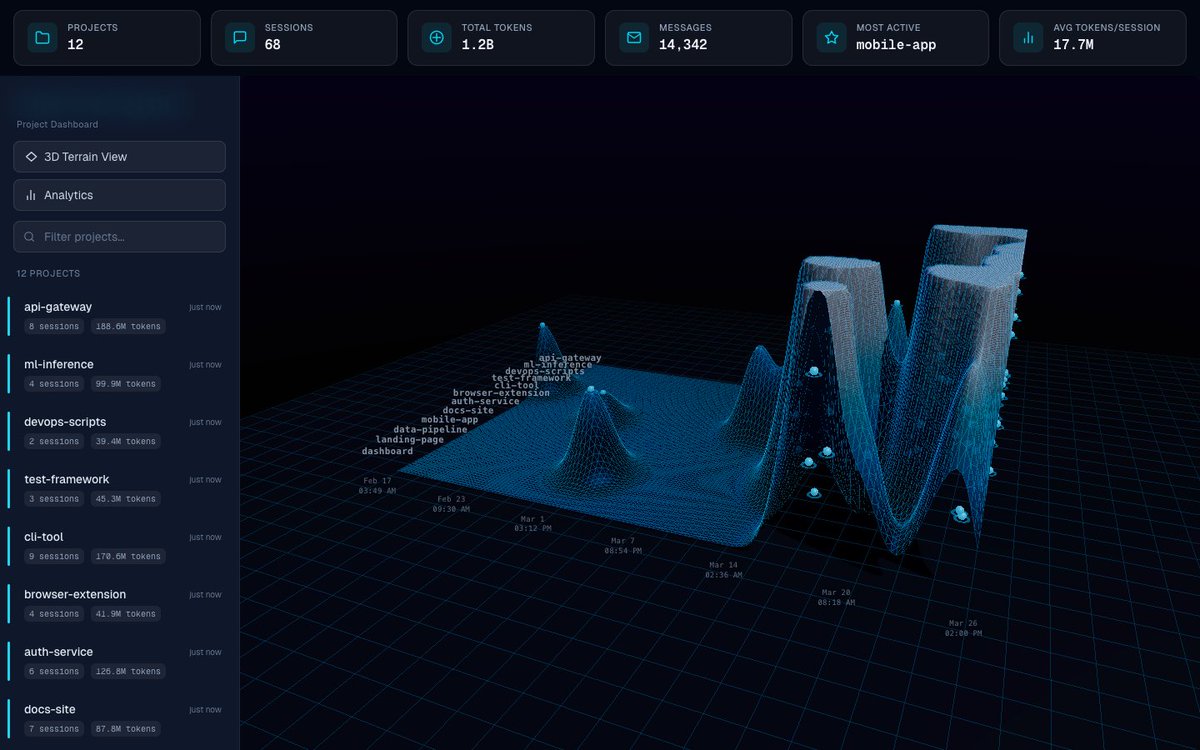 Claude Code Inspector 3D terrain view showing token usage across projects over time
The 3D terrain view maps your token usage across projects over time. Peaks show where you’re burning through context. The project sidebar tells you exactly how many sessions and tokens each repo has consumed.
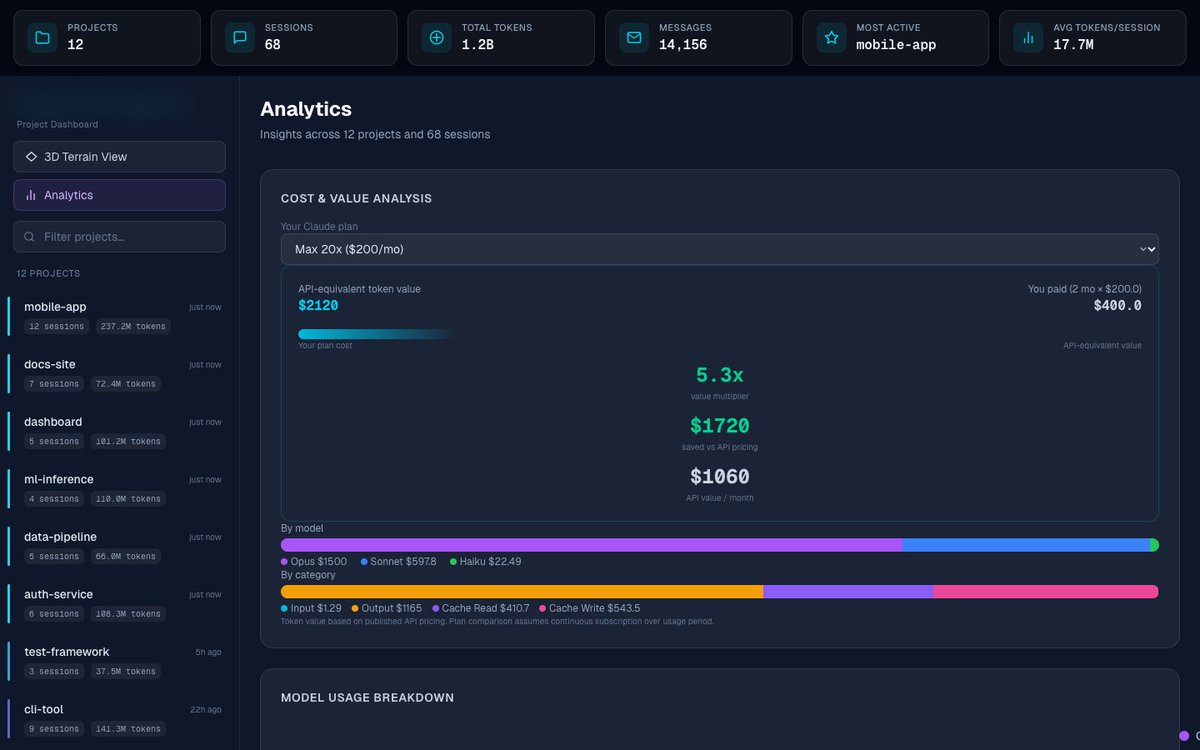 Claude Code Inspector analytics view showing cost and value analysis
The analytics view is where it gets interesting. Pick your Claude plan from the dropdown, and it calculates the API-equivalent value of your usage against what you actually paid. In this example, a Max 20x plan at $200/month delivered $2,120 worth of API-equivalent tokens. That’s a 5.3x value multiplier. Good to know when you’re deciding whether to stay or switch to raw API access.
It breaks down spend by model too. You can see exactly how much of your budget went to Opus vs. Sonnet vs. Haiku, and how much came from input tokens, output tokens, cache reads, and cache writes.
Nothing leaves your machine
This is the part that matters most, given the current climate of trust. Claude Code Inspector runs entirely locally. Your session data never gets uploaded anywhere. There’s no analytics beacon, no telemetry, no “anonymous usage data” heading to a server you don’t control.
Your data stays in ~/.claude. The dashboard reads it, renders it in your browser, and that’s the end of the story.
When the company that controls your AI coding tool can change the economics on you with a tweet, the least you can do is understand your own usage. You can’t control their pricing decisions. You can control whether you’re making informed ones.
The pitch
Claude Code Inspector is free to use for the core features: 3D terrain visualization, project inspection, and session detail modals. There’s an Analytics Pro tier at $14.99/year that unlocks the deeper cost analysis, model breakdowns, and cache efficiency tracking.
Check it out: hummusonrails.github.io/claude-code-inspector
Source is on GitHub: github.com/hummusonrails/claude-code-inspector
If you’re paying for Claude Code and you don’t know your token-to-dollar ratio, you’re negotiating with one hand behind your back. Stop guessing.